
Multi-Touch Attribution (MTA) Beyond Digital Channels
History
Multi-touch attribution is critical for marketers who want to truly understand ROI of their various channels. While the term “MTA” is en vogue right now, this has been a problem for marketers for a long time. In the 1960s, television advertising might be driving some proportion of sales at retail, but no one knew how much. To solve this problem, statisticians used the tools of econometrics to build regressions that estimated the impact of advertising on sales. Thus, marketing mix modeling (MMM) was born.
Crude, direct attribution of sales was another way to do it. “How did you hear about us?” questions are still used everywhere. This technique shouldn’t be scoffed at. Even if half of customers skip the question or select “other”, the remaining proportion of answers can give marketers a pretty idea of how marketing is performing, as a whole.
Digital Multi-Touch Attribution
In the 2000s, as digital channels became more prevalent, the possibilities for tracking customers along the journey blossomed. Cookies and pixels allow a customer to be tracked throughout their journey, at least in theory. In fact, multi-touch attribution has become synonymous with digital multi-touch attribution for many marketers.
Digital multi-touch attribution relies on a combination of cookies, pixels, and device fingerprints, knitted together by an identity resolution service. For example, a customer might be cookied by a brand site, allowing the brand to know the various views and entries for that customer on their domain. At the same time, a device fingerprint is catalogued by a third-party identity resolution service like LiveRamp, allowing that customer’s views on a separate ad network or set of publishers to be known. This same basic pattern of creating a lookup table for customers by matching device fingerprints, email addresses, cookies, and so on is repeated until a unified customer behavior dataset is created.
There are multiple problems with a digital-only MTA approach. First, consumers are exposed to many different channels across their marketing journeys, and while digital is getting more important every year, television, print, direct mail, out-of-home, and radio all still make contributions to performance. Digital-only MTA approaches don’t have an answer to this problem.
Second, the time component is difficult. In some cases, a learn-shop-buy cycle happens in minutes; for these practically instant buying occasions, digital MTA works well. However, for many others, particularly considered purchases for things like automobiles, insurance policies, or B2B software, the process take weeks or even months. Digital data sources lose fidelity over time, due to cookie loss, identifier degradation, VPN usage, and many other factors, making digital MTA problematic.
Finally, new data privacy regulations are making digital snooping—which is what digital MTA really is—harder and harder. The GDPR and California’s privacy standards makes consumer identity resolution very difficult in the EU, and behavioral targeting has become less and less “OK” since the Cambridge Analytica scandal. Apple’s ITP (Intelligent Tracking Prevention) platform has dramatically locked down the ability of companies to do identity resolution across the Apple ecosystem—essentially locking down 1/3 of the devices and individuals in the U.S. for digital MTA.
Econometric Multi-Touch Attribution
To go beyond digital channels, you have to think about data differently. In today’s big data marketing environments, the “graph” approach is very common. In this approach, each customer is linked to another in a long, relational chain. For example, a customer is linked to 17 touches, each with a different channel, date-time stamp, etc. This data structure makes a lot of sense if you’re trying to build a customer-level fingerprint.
Econometric data sets instead use predictable aggregations to structure data. For example, a data set might be aggregated by week, and by one or more “panels.” A common panel is DMA—the Nielsen geographic grouping for television ratings that has become a de facto standard for marketing measurement.
The advantage of structuring multi-touch data sets in this fashion is that the limitations mentioned above for building a graph—in other words, linking touches together using an identity service, cookies, or PII—don’t exist. Instead, we sum up all of the interactions for a given channel for a given week for a given panel.
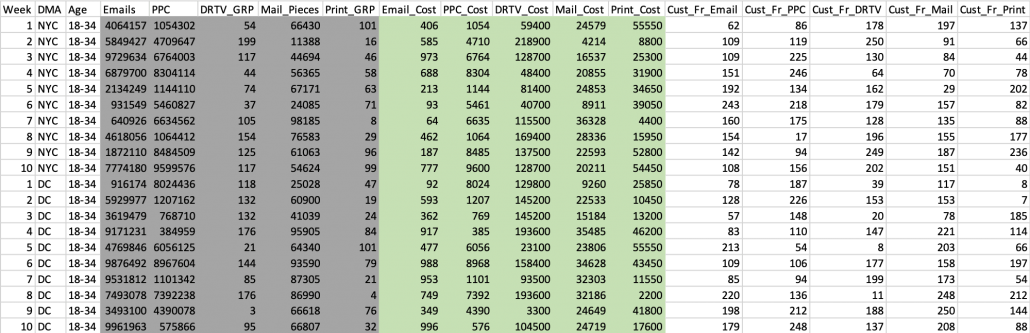
Figure 1: Example of the first several rows on an econometric time series structured (panel) data set.
This sounds an awful lot like marketing mix modeling (MMM). What’s different is the final step—building out the dependent variables. Here, instead of using one dependent variable like “sales” or “number of transactions”, we use a matrix of dependent variables, each representing the last touch channel attribution. For example, we would have one variable “email attributed sales”, another “pay-per-click attributed sales”, etc.
This allows us to do two things. First, we can understand what percentage of a channel’s last-touch attributed sales it actually drove. Secondly, we can estimate that channel’s impact on all of the other channels. These two numbers together might be more than or less than the total “directly attributable” or last-touch sales.
For example, we might find out that over the analysis period, only 55% of direct mail’s sales were directly attributable to direct mail. However, direct mail might have had an outsize effect on paid search clicks (40% of the directly attributable DM sales) and organic web sales (25%), making its total impact 120% of its direct impact—making it a better performing channel than it appears.
We can also understand non-linear effects with this method. By using an apples-to-apples stimulus metric—typically variable or “media” cost—we can transform both independent and dependent variables with natural logarithms. This allows us to understand the elasticity of demand in response to stimulus—a number between 0 and 1, where a higher number indicates a less dramatic diminishing returns as spend is increased. This insight is extremely valuable when trading channels off against one another.
Finally, by transforming time series variables, we can understand how different channels contribute to marketing effectiveness over time. For example, mail is sometimes left on tables or pinned to bulletin boards. To understand that impact, the data scientist applies a rolling decay to that independent variable—for example, 100 pieces of mail in week 1, 90 pieces in week 2, 81 in week 3, and so on, using a 10% week-on-week decay. By understanding time lag, the campaign planner can make strategic decisions on when to put various media into market to work as well as possible together.
For a more in-depth case study of multi-channel, online-offline MTA, check out this detailed case study.
Conclusion: It’s Critical to Attribute Sales to Both Offline and Online Channels
While a technological approach to tracing a sale’s provenance is valuable when it comes to trading off digital channels, for most large businesses, and particularly for considered purchases, this will miss the critical offline and “hidden” channels that customers interact within the real world. An econometric approach to MTA, while unable to pinpoint where a specific sale was attributed, can be used to understand how sales / deals / leads are typically driven by segment, channel, and time. Furthermore, using an always-on data approach, these estimates can be updated quarterly or even monthly, enabling the tracking of marketing performance through time and trend-spotting.
Are you truly measuring the ROI impact of ALL of your marketing channels?
Marketing through multiple channels is the right move; customers rapidly switch between communication modes, and some segments are more reachable in one channel than in another. However, measuring the interactions between channels—particularly direct response and broad reach—is notoriously difficult. ROI-tunnel vision has led companies to focus their efforts on channels that are more easily measured, while channels with harder-to-measure success dwindle. Download our framework on measuring your entire marketing halo.